The promotion dashboard is where the data collected from your Promotion is displayed. The data displayed on this page includes:
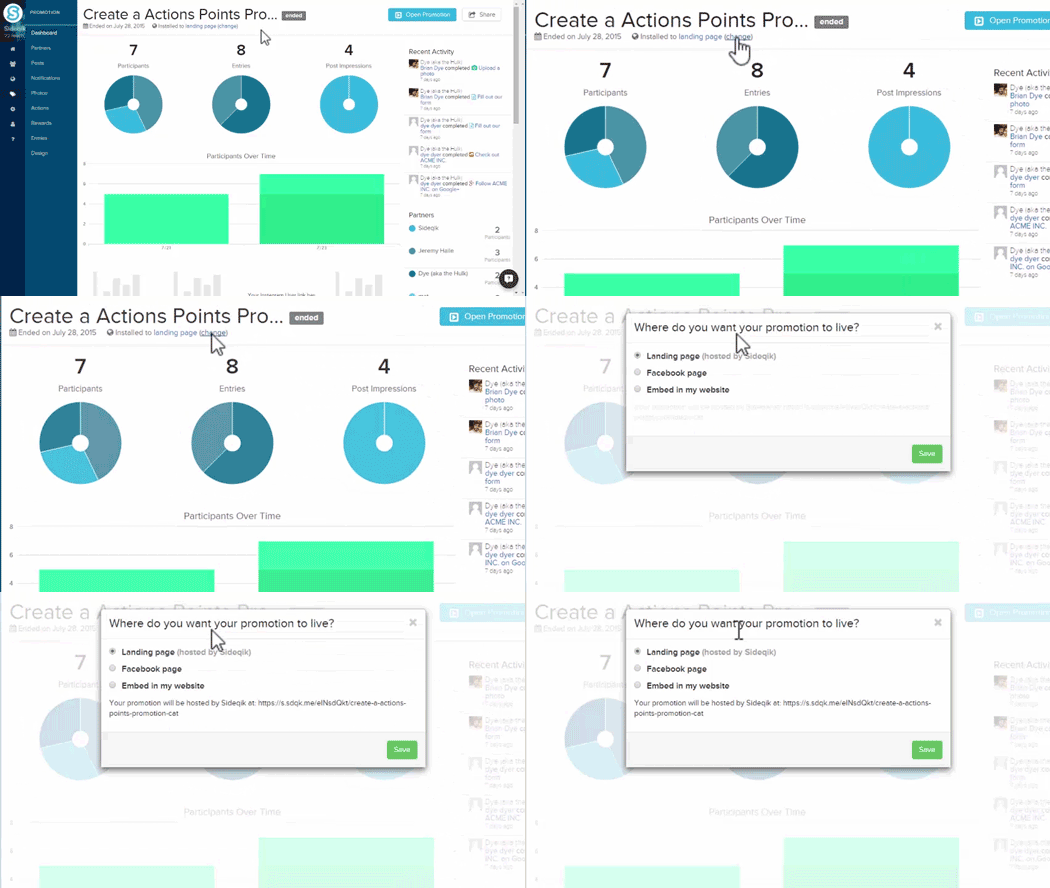
- Hosting options for your landing page
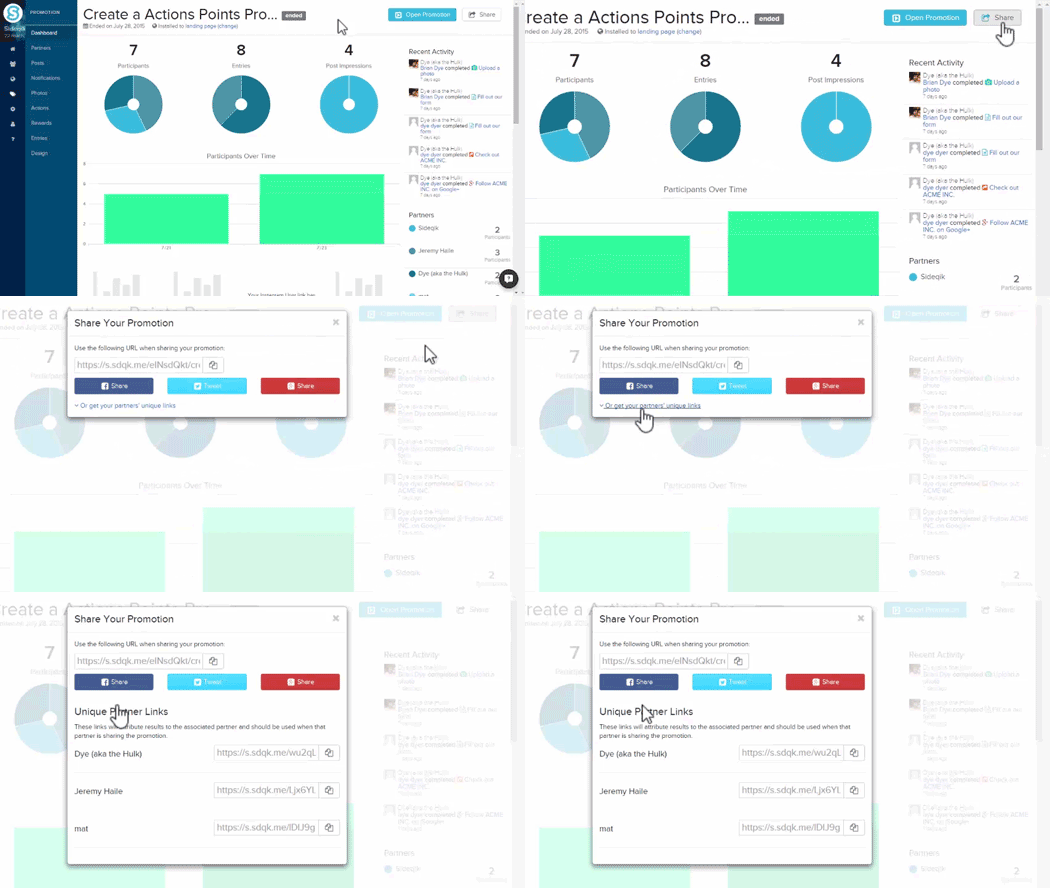
- Unique tracking link
- Total participants / entries / impressions by partner
- Timeline of promotion activity
- Participants per partner
- Growth per action
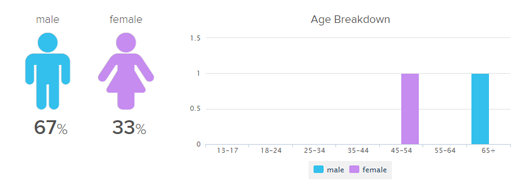
- Gender and Age breakdown
- Recent and Upcoming posts
Hosting Options

The available options for hosting your landing page are through Sideqik's server, on Facebook or embedded on a separate website. By selecting the first option, "Landing Page (hosted by Sideqik)," the promotion's landing page will be hosted on Sideqik's serve and you will be provided with a unique tracking link. This link will automatically update to your promotion's dashboard.
Selecting "Facebook Page" will automatically post the landing page to the connected Facebook account when the promotion launches. A message displaying "Your promotion will be installed to: [FB Account]" will let you know that your promotion is connected.
The bottom option, "Embed in my website," will automatically produce an embed code for the landing page. For the share link of the promotion to work correctly it is required to include the webpage the promotion will be hosted on. This is to accurately collect the necessary data to be displayed on your dashboard.
Unique Tracking Link

Sideqik automatically creates a unique tracking link for you and your partners. By selecting the "Share" button in the top right corner of the screen, a pop-up menu will allow you to copy the link assigned to you. By choosing a social share button underneath the link a new window will allow you to edit the social post promoting your landing page. By selecting "Or get your partners' unique links" at the bottom of the pop-up window you will be able to view and copy your partners' unique links.
Total Participants / Entries / Post Impressions by Partner

The top row of the dashboard displays a breakdown of the total participants, entries and post impressions for your promotion. These numbers are updated automatically and the data is drawn from each partner's unique tracking link.
By clicking on each data set, the growth over time in the second row will change to reflect the data set selected since the start date of the promotion. The growth over time is reflected as light green being the new participants, entries or impressions and the dark green being the participants, entries or impressions from previous days. Hovering over the separate segments of the top row will provide further clarification on which partner is being represented where on the graph. Hovering over the growth over time segments will provide details on the data pulled specifically on the selected date.
Timeline of Promotion Activity
The column located on the right side of the promotions dashboard shows those who have participated in your promotion and the actions they took. By clicking on the participants name, a separate pop-up window will show the information gathered about the participant, such as [update in progress]. This window will also show the actions taken by this fan on this promotion. By selecting the actions performed next to the fans' name, you will be open a separate screen showing every fan who has completed that action. On this screen you are able to see the general information and complete list of each fan who has completed that particular action. To export the completed actions list into a .csv select the "Export" button located in the top right of the page.
Participants per Partner
Below "Recent Activity," located on the right side of the screen, is a breakdown of the partners and the amount of participants each has brought into the promotion. The partners who have accepted an invitation will appear in this list. Partners will be listed in descending based on the number of fans they have brought in who have participated in the promotion.
Growth per Action

The third segment of your promotion dashboard shows the total growth across every field available in your promotion. The data which will be displayed here in this section will show the new emails, visitors and social followers your promotion has generated. This segment will always show both email and visitor growth regardless of the promotion type or the actions added. Each growth segment will be organized with the same color theme as the participant, entry and post impression graphs in the first section.
Gender and Age Breakdown

This section displays the percentages of male and female fans who have participated in your promotion as well as a breakdown of the age. This data is collected from those who have completed actions within your promotion. In the age breakdown of your promotion it is possible to filter between male and female genders. When a gender is clicked it's data will be hidden from the age breakdown chart. When the hidden gender is re-selected it will re-appear on the graph. This feature is helpful to isolate demographics and analyze possible trends emerging from your promotion.
Recent and Upcoming Posts

The bottom of your promotion dashboard displays the upcoming posts scheduled to be published and posts which have already been published across your social channels. Under "Recent Posts" you are able to see the post impressions and clicks generated by the latest posts promoting your promotion. Selecting either "Impressions" or "Clicks" will produce a pop-up window displaying a breakdown of the traffic driven by the individual partners. By selecting "Clicks" the pop-up window will display the breakdown between Twitter and Facebook, each social platform is further broken down by a percentage.
Customization for Each Promotion Type:
- Promotion - Design ( Action Promotion)
- Promotion - Design (Simple Entry Promotion)
- Promotion - Design (Poll Promotion)
Comments
0 comments
Please sign in to leave a comment.